中文
GitHub
Docs
Deployment
User Guide
Example
中文
GitHub
Docs
Example
Guest
Sign in
MrDoc Document Example
Markdown document example
Quote text
Audio and video
Attachment preview
Link effects
Images and attachments
Documentation table of contents
Code block effects
Table effects
List effects
Symbols and emoji
Scientific formulas
Flowchart
Sequence diagram
Strikethrough, bold, italic, superscript and subscript
Markdown text highlighting
Mind map, mind map, mindmap.
ECharts graphs and charts
Timeline
50,000-word ultra-long document
Mermaid diagrams
Markdown test document
Rich text document example
Documentation table of contents
Online spreadsheet document example
This is an online spreadsheet
Online spreadsheet with local Excel import
Mind map document
Hand-drawn diagram documentation
Office documents
OnlyOffice online documents
OnlyOffice online spreadsheet
OnlyOffice Slides
Powered by MrDoc Pro
-
+
home
ECharts graphs and charts
# Echarts Graphics and Charts MrDoc supports inserting Echarts graphics and charts in the Markdown editor, which are then displayed on the document page. ## Syntax ```echart Echart configuration options ``` You can also directly click :fa-bar-chart: in the toolbar to quickly generate an echarts code block in the document.  ## Example ```echarts { "xAxis": { "type": "category", "data": ["Mon", "Tue", "Wed", "Thu", "Fri", "Sat", "Sun"] }, "yAxis": { "type": "value" }, "series": [{ "data": [820, 932, 901, 934, 1290, 1330, 1320], "type": "line" }] } ``` The above code will display the Echart graphic shown below: ```echart { "xAxis": { "type": "category", "data": ["Mon", "Tue", "Wed", "Thu", "Fri", "Sat", "Sun"] }, "yAxis": { "type": "value" }, "series": [{ "data": [820, 932, 901, 934, 1290, 1330, 1320], "type": "line" }] } ``` ## Chart Configuration Options For specific Echarts configuration options, refer to the [Echart official examples](https://echarts.apache.org/examples/zh/index.html). For example, in the official Echarts examples, the basic configuration options for a graphic are shown in the figure below: 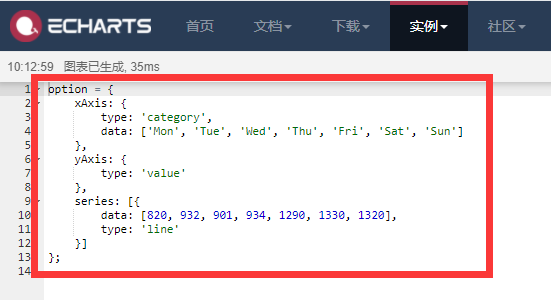 The configuration content we need is `{}` and everything between them, with all key names and strings wrapped in English double quotes: ```json { "xAxis": { "type": "category", "data": ["Mon", "Tue", "Wed", "Thu", "Fri", "Sat", "Sun"] }, "yAxis": { "type": "value" }, "series": [{ "data": [820, 932, 901, 934, 1290, 1330, 1320], "type": "line" }] } ``` ## Key Points Remember two points: 1. Be sure to modify according to the configuration file of the official Echarts examples. 2. The key names of the configuration options must be wrapped in `"` double quotes; 3. The end of the configuration options must not contain a `;` semicolon.
mrdoc
Sept. 29, 2026, 6:37 p.m.
Forward
Favorites
Last
Next
Scan the QR Code
Copy link
Scan the QR code to share.
Copy link
share
link
type
password
Update password
Validity period
Markdown file
Word document
PDF document (print)
